

Productions function: Production is the process by
which inputs are transformed in to outputs. Thus there is relation between
input and output. The functional relationship between input and output is known
as production function. In economics, equation that expresses the relationship
between the quantities of productive factors (such as labour and capital) used
and the amount of product obtained. It states the amount of product that can be
obtained from every combination of factors, assuming that the most efficient
available methods of production are used.
It
can be expressed in algebraical form as under:
x =f
(a1, a2,…………………………… an)
This
equation tells us the quantity of the product X which can be produced by the
given quantities of inputs (lands labour, capital) that are used in the process
of production. Here, it may be noted that production function shows only the
maximum amount of output it which can be produced from given inputs. It is
because production function includes only efficient production process.
A production indifference curve
and its properties:
(1) Indifference Curves are
Negatively Sloped:
The indifference curves must slope down from left to right. This means that an
indifference curve is negatively sloped.

In
fig. 3.4 the two combinations of commodity cooking oil and commodity wheat is
shown by the points a and b on the same indifference curve. The consumer is
indifferent towards points a and b as they represent equal level of
satisfaction.
(2) Higher Indifference Curve
Represents Higher Level:
A higher indifference curve that lies above and to the right of another
indifference curve represents a higher level of satisfaction and combination on
a lower indifference curve yields a lower satisfaction.

In
this diagram (3.5) there are three indifference curves, IC1, IC2
and IC3 which represents different levels of satisfaction. The
indifference curve IC3 shows greater amount of satisfaction and it contains
more of both goods than IC2 and IC1 (IC3 >
IC2 > IC1).
(3) Indifference Curve is Convex
to the Origin:
This is an important property of indifference curves. They are convex to the
origin (bowed inward). This is equivalent to saying that as the consumer
substitutes commodity X for commodity Y, the marginal rate of substitution
diminishes of X for Y along an indifference curve.

(4) Indifference Curve Cannot
Intersect Each Other:
Given the definition of indifference curve and the assumptions behind it, the
indifference curves cannot intersect each other. It is because at the point of
tangency, the higher curve will give as much as of the two commodities as is
given by the lower indifference curve. This is absurd and impossible.
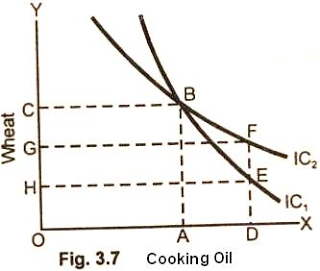
In
fig 3.7, two indifference curves are showing cutting each other at point B. The
combinations represented by points B and F given equal satisfaction to the
consumer because both lie on the same indifference curve IC2.
Similarly the combinations shows by points B and E on indifference curve IC1
give equal satisfaction top the consumer.
(5) Indifference Curves do not touch
the Horizontal or Vertical Axis:
One of the basic assumptions of indifference curves is that the consumer
purchases combinations of different commodities. He is not supposed to purchase
only one commodity. In that case indifference curve will touch one axis. This
violates the basic assumption of indifference curves.


No comments:
Post a Comment